Consulting Statistics
For DSC staff and library administration — direct consultation counts, project task metrics, and patron breakdowns.
At a Glance (2021–2026)
Last rendered: March 10, 2026
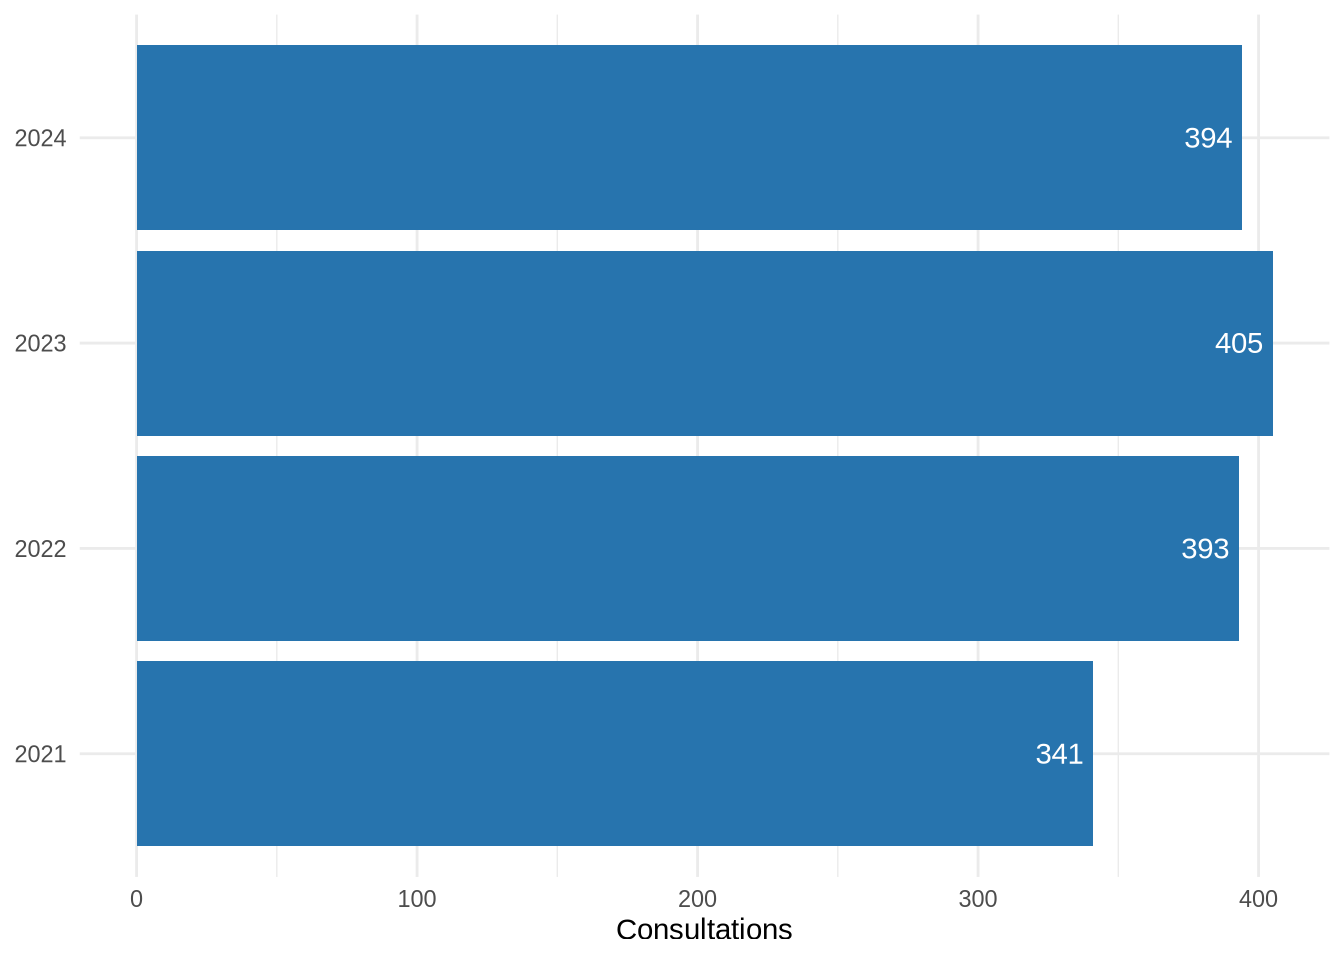
Direct Consultations 741 DSC + DataSquad combined; canceled excluded · ↓ -41% · 238 in 2024 vs 405 in 2023
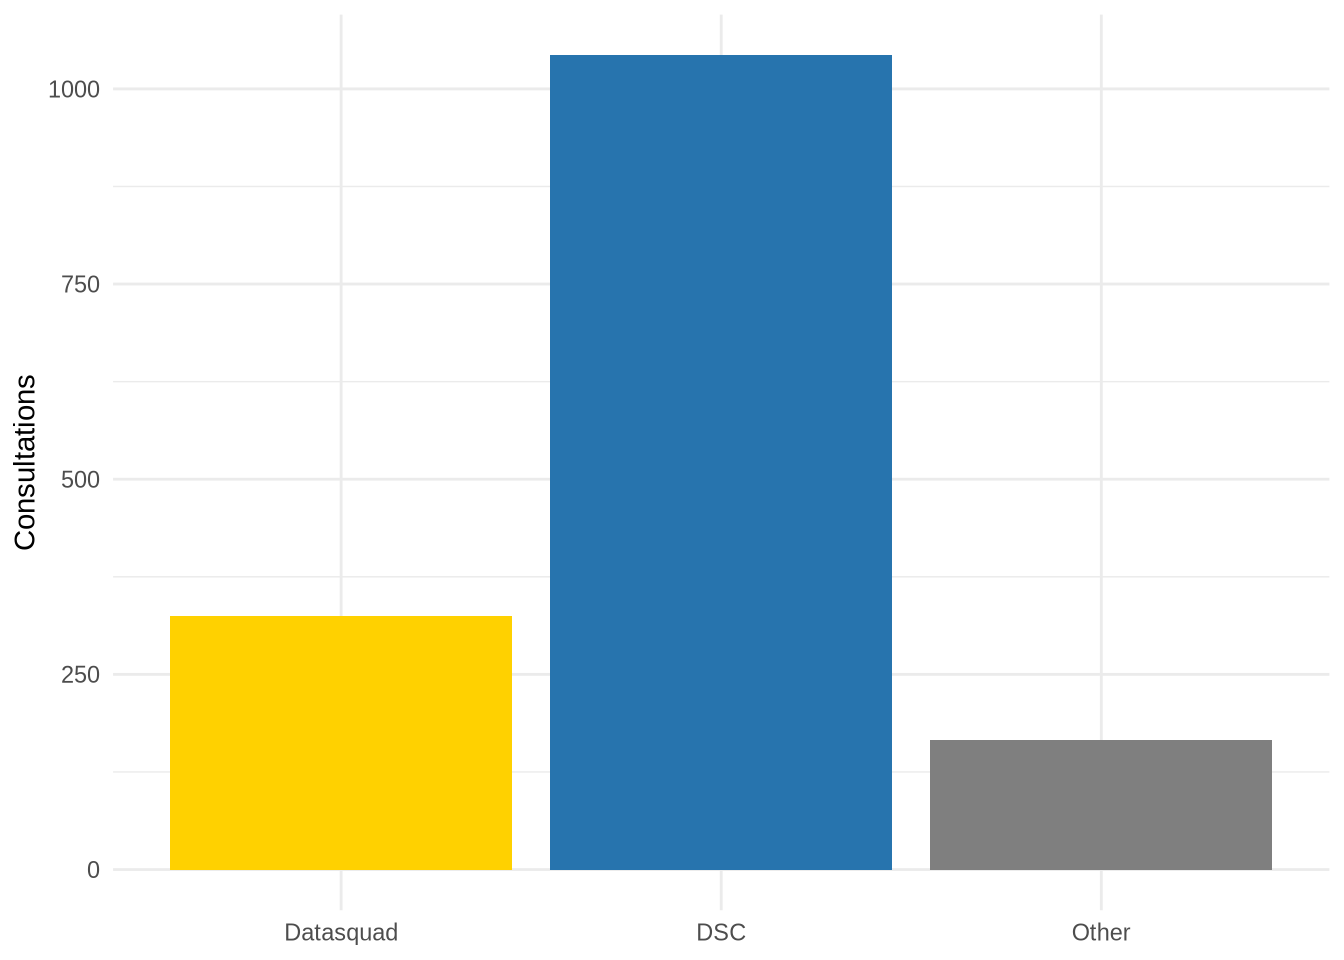
DSC Staff 462 LibInsight scheduled exports
DataSquad 142 Walk-in sign-ins
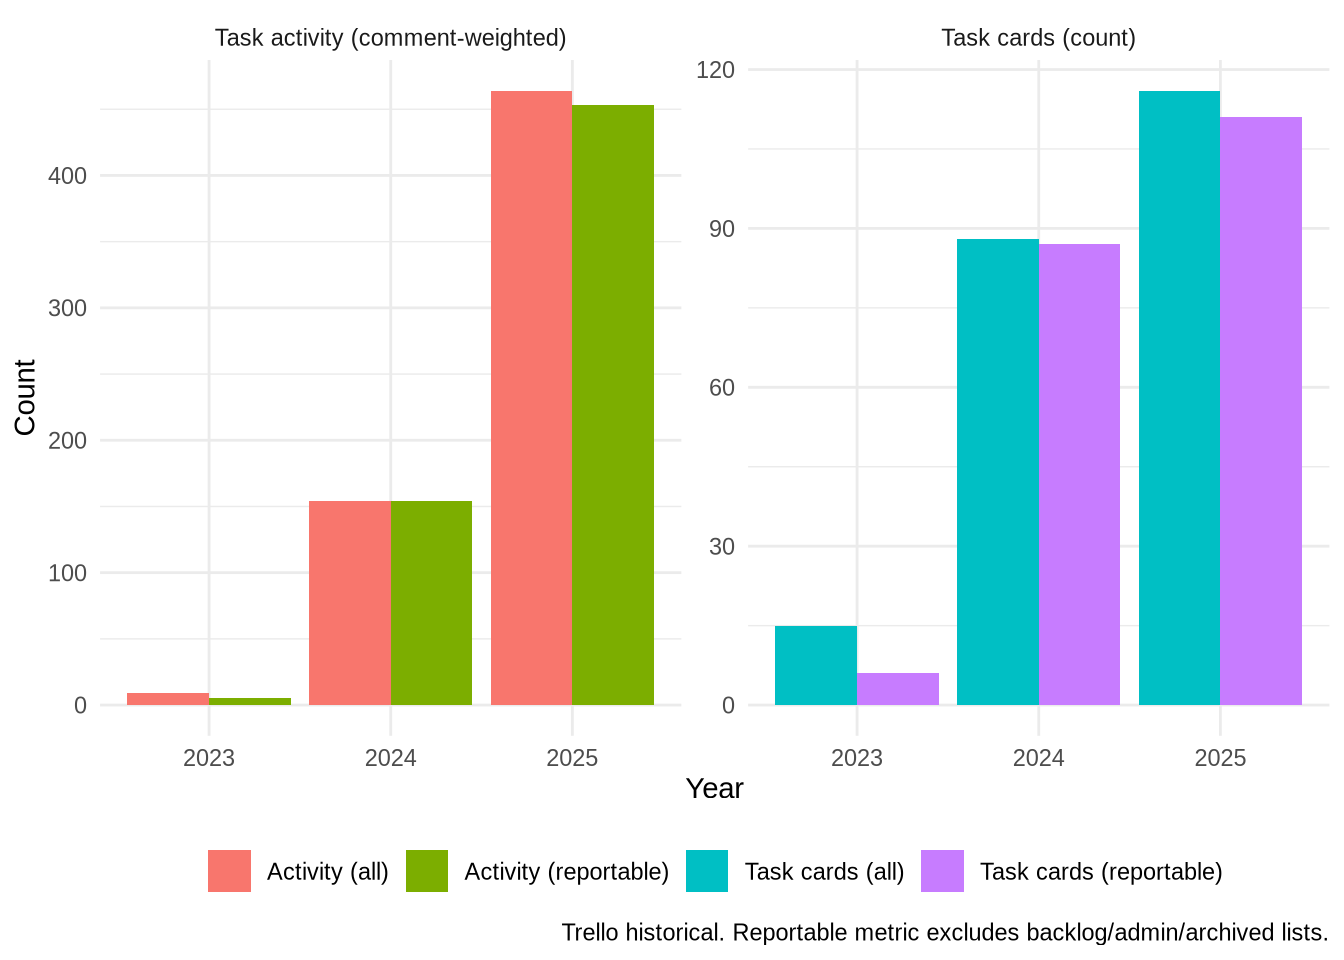
Task Cards (Reportable) 204 Trello; backlog/admin lists excluded · ↑ +1350% · 87 in 2024 vs 6 in 2023
Direct Consultations
Project Work & Task Metrics
These metrics represent follow-on project work assigned to DataSquad members. They are not direct consultations.
| Metric | Value |
|---|---|
| Direct Consultations (Combined, Deduped) | 741 |
| DataSquad Task Cards (Reportable) | 204 |
| DataSquad Task Activity (Reportable, Comment-Weighted) | 612 |
| DataSquad Direct + Reportable Task Activity | 754 |
Research Impact
These examples show how DSC and DataSquad support extends into sustained technical collaboration beyond single consultations.
Carceral Ecologies
Partners: UCLA Institute for Society and Genetics (Nicholas Shapiro)
The DSC and UCLA DataSquad provided multi-year research support for the Carceral Ecologies Lab, including R server infrastructure, data processing support, and student training for work on a helicopter surveillance dataset. In collaboration with DSC staff, DataSquad contributors helped build a workflow that made iterative analysis feasible at research scale.
Measurable outcomes: Reduced processing time from ~318 minutes to ~2 minutes (about a 99.4% reduction; ~159x faster). Built sustainable capacity by training a research student in R-based workflows.
Impact signals: National media coverage (Los Angeles Times, The New Yorker, Bloomberg) and support for award-recognized UCLA public-impact research.
BioCritical Studies Lab
Partners: UCLA (Grace Sosa; Terence Keel)
The DSC and UCLA DataSquad supported the BioCritical Studies Lab through a multi-year collaboration focused on data integration, statistical analysis, and visualization for a large deaths-in-custody research dataset. DataSquad consultants worked with DSC staff to build sustainable tools and workflows that improved maintainability and ongoing use of the data.
Measurable outcomes: Substantial dataset cleanup and transformation for geographic analysis and visualization, with workflows designed for continued updates and reuse.
Impact signals: Supported research recognized through UCLA’s 2024 Public Impact Research Awards and contributed to long-term public-facing scholarship and teaching outputs.
| period label | workstream | audience | request theme | work performed | outcome |
|---|---|---|---|---|---|
| 2025 Q1 | datasquad | faculty | data management | Reviewed repository options, metadata needs, and access constraints for course use | Identified a workable publication/access path and follow-up implementation steps |
| 2025 Q1 | dsc | student | geospatial analysis | Provided troubleshooting and workflow guidance for GIS data integration | Unblocked next analysis steps and clarified tool-specific workflow decisions |
| 2025 Q1 | datasquad | staff | programming workflow | Investigated code/tooling options and documented a reproducible approach | Delivered a documented approach the requester could continue independently |
See also: Instruction → workshop attendance · Infrastructure → Dataverse and AWS metrics · About & methodology
NoteData notes
- Direct consultations: LibInsight scheduled exports + manual logs (DSC staff); DataSquad walk-in sign-in forms
- Canceled appointments excluded from all direct consultation counts
- Deduplication: manual LibInsight logs matched against scheduled exports using a same-provider/same-minute heuristic; ~4 duplicates removed
- Task metrics (Trello cards, comment-weighted activity) are shown separately — not comparable to consultation counts
- Reportable filter: excludes
Inbox,Future Projects/Ideas,Team Infolists; includes archived completed cards - YoY comparisons (2023 → 2024): direct consultation decline reflects shifting data sources and intake channels, not necessarily service volume; task card growth reflects expanded Trello adoption in 2024, not a proportional workload increase
- Full rules: Metrics Governance · About
NoteCite this page
UCLA Library Data Science Center. (2026). Consulting Statistics. Retrieved from https://ucla-data-science-center.github.io/dsc-stats-reports/consulting.html
Last rendered: March 10, 2026