Instruction Statistics
For DSC staff and library administration — workshop attendance records from LibInsight event exports.
Last rendered: March 10, 2026
At a Glance (2020–2024)
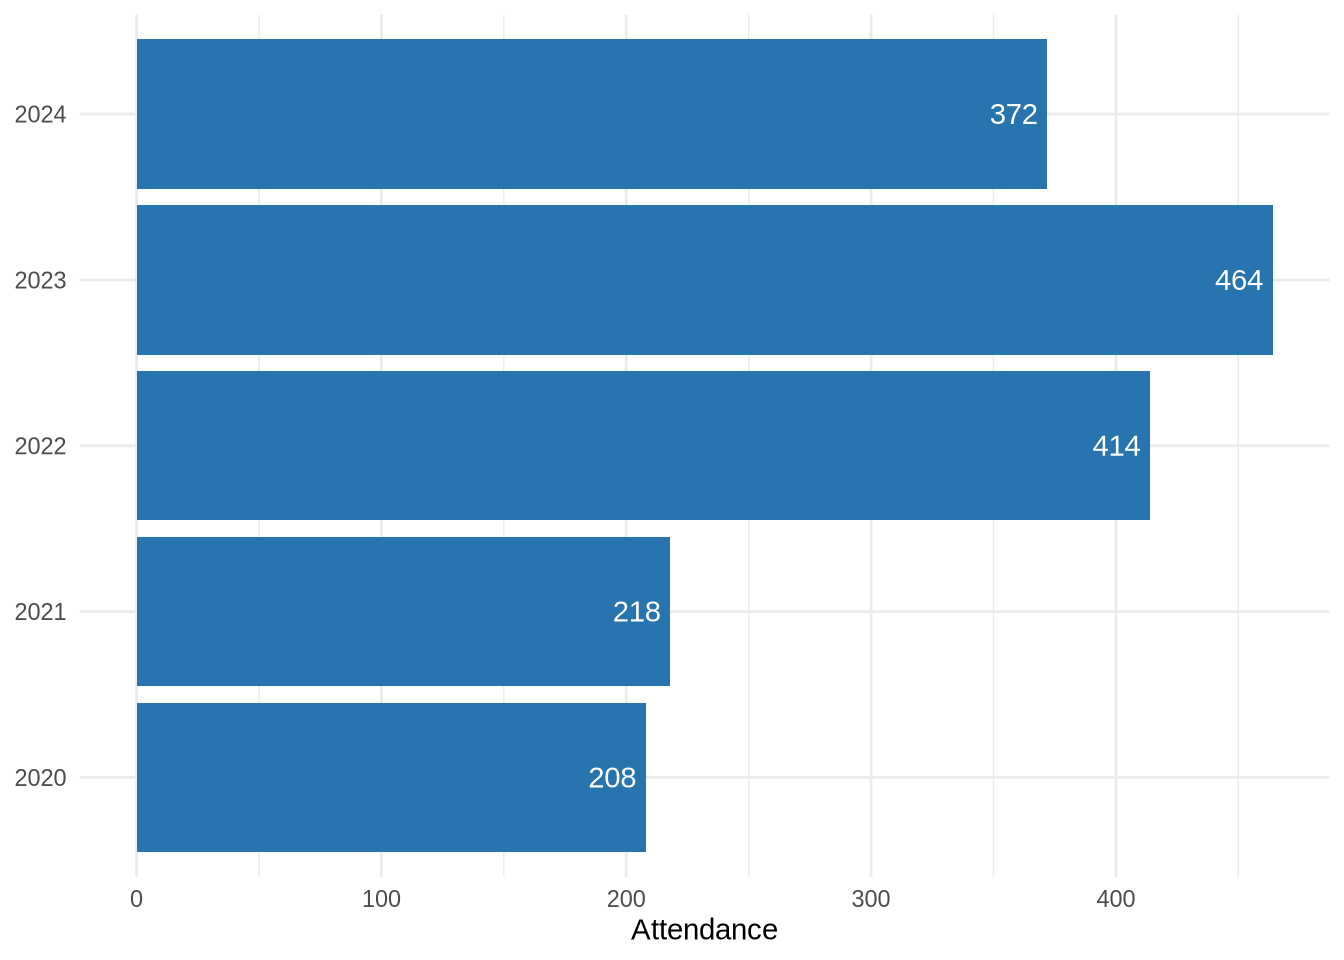
Total Attendance Records 1,676 All workshop participants, all years · ↓ -20% · 372 in 2024 vs 464 in 2023
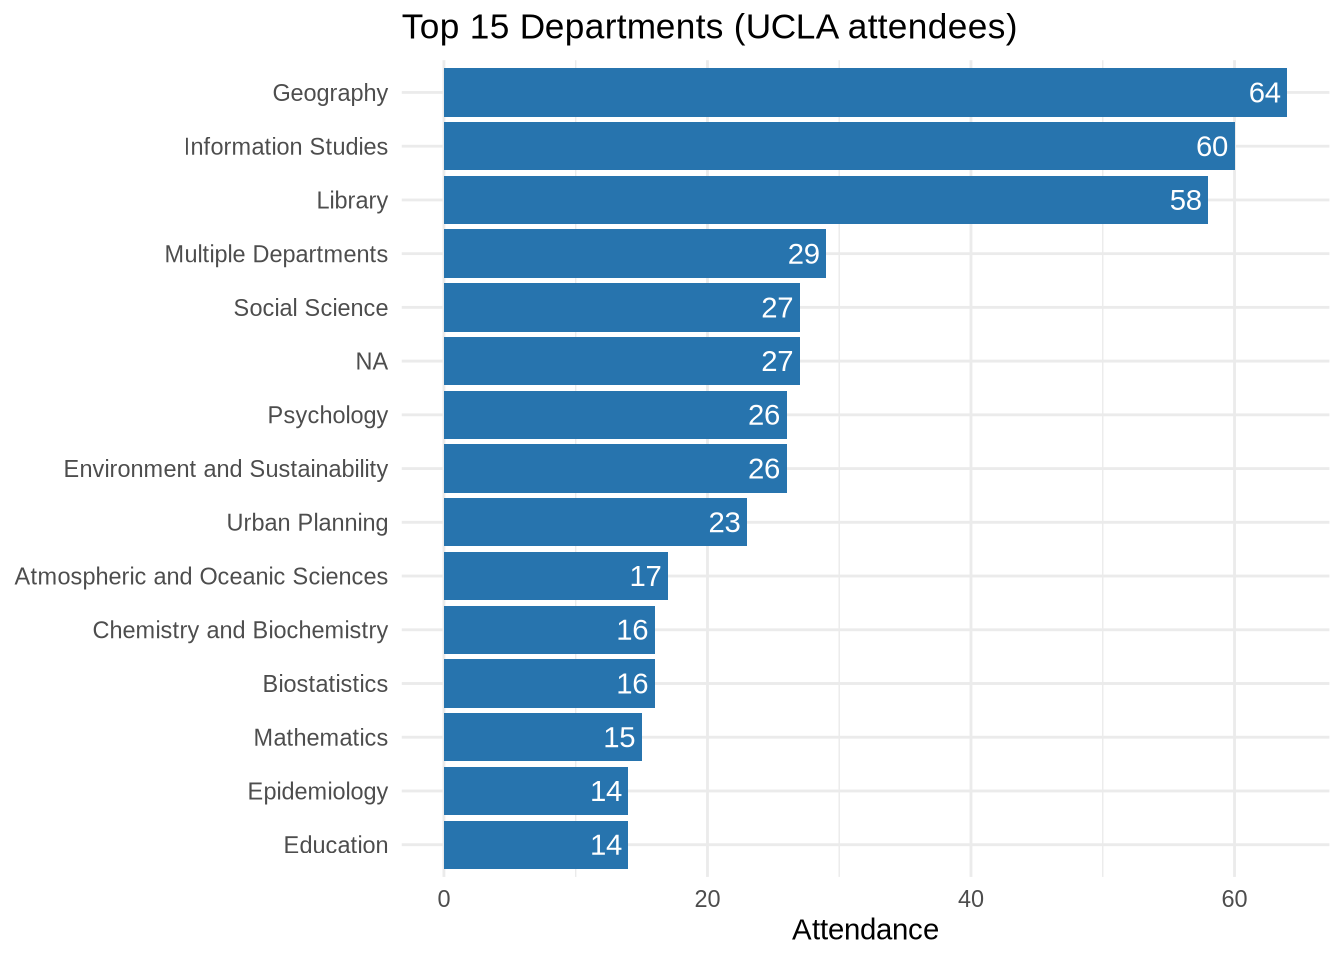
UCLA-Affiliated 1,575 institution == “UCLA”
Years with Data 5 Distinct calendar years
Workshop Attendance
See also: Consulting → one-on-one consultations · Infrastructure → Dataverse and AWS metrics · About & methodology
NoteData notes
- Source: LibInsight workshop/event attendance exports
- Unit: One row = one participant registration. A person attending three workshops is counted three times — totals reflect attendee-events, not unique individuals
- UCLA attendees: filtered on
institution == "UCLA"; external attendees included in totals but excluded from department breakdowns - Department:
standardized_departmentfield — mapped from raw free-text entries; unmapped values appear as-is - Full rules: Metrics Governance · About
| Source | Record type | Rows | Date range |
|---|---|---|---|
| LibInsight | workshop_attendance | 1,676 | 2020-11-17 – 2024-04-19 |
NoteCite this page
UCLA Library Data Science Center. (2026). Instruction Statistics. Retrieved from https://ucla-data-science-center.github.io/dsc-stats-reports/instruction.html
Last rendered: March 10, 2026